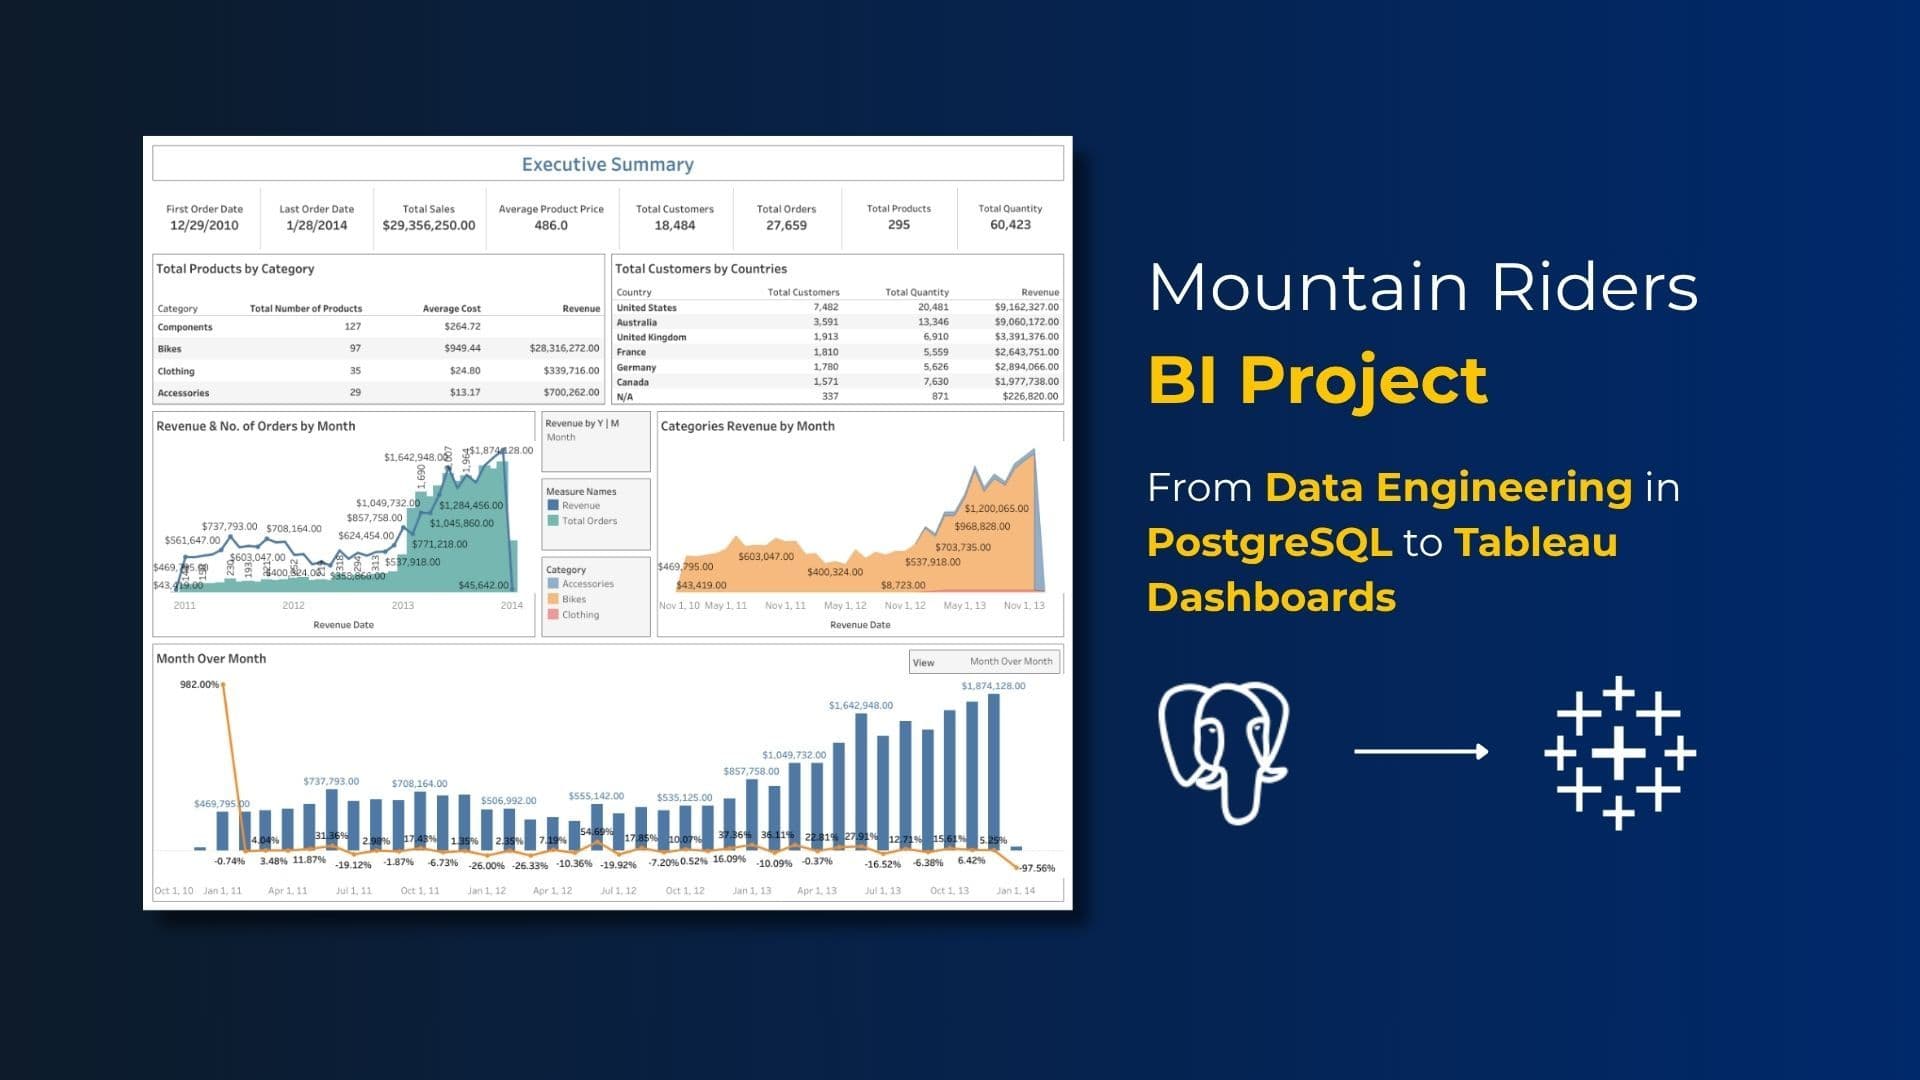
Introduction
“You can’t improve what you don’t measure.” For Mountain Riders, a specialty bike seller, building a centralized analytics system changed the way they understood customers, products, and growth trends.
In this post, I walk you through the complete journey of building a PostgreSQL-based Data Warehouse and crafting interactive Tableau dashboards for high-impact insights.
🏗️ Phase 1: Building the Data Warehouse (PostgreSQL)
Goals
- Consolidate data from multiple source systems
- Enable scalable analysis via optimized schema
Key Tasks
- Schema Design (Star Schema)
- ETL Pipeline (SQL)
- Data Cleaning & Surrogate Key Creation
- Indexing for performance
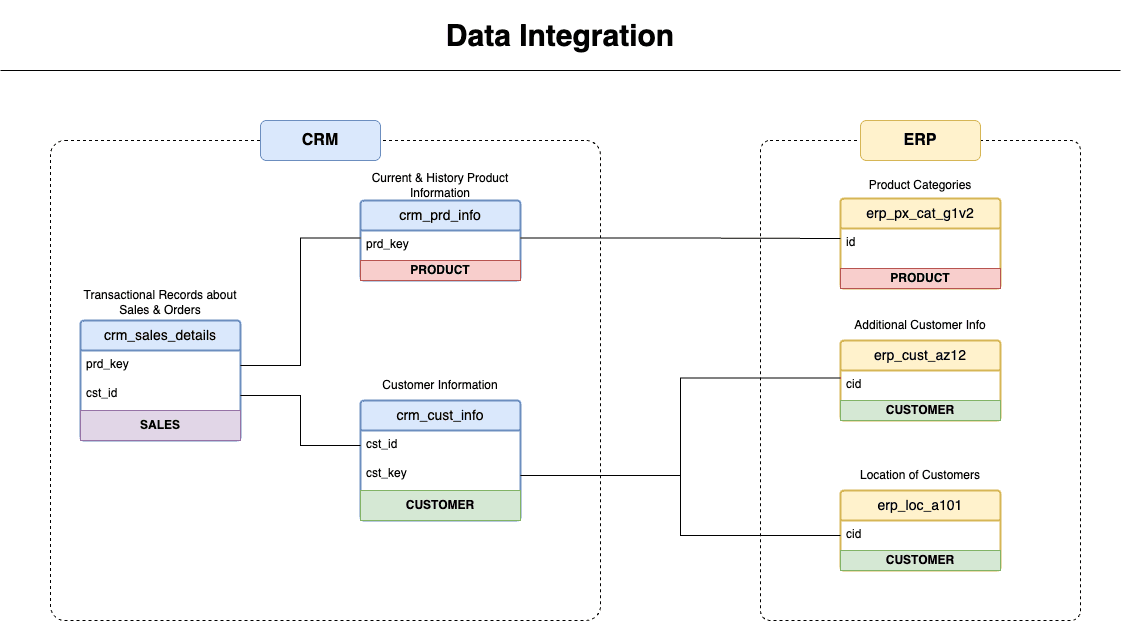
Data Modeling
- Star schema design with Fact and Dimension tables
Data Ingestion & Transformation
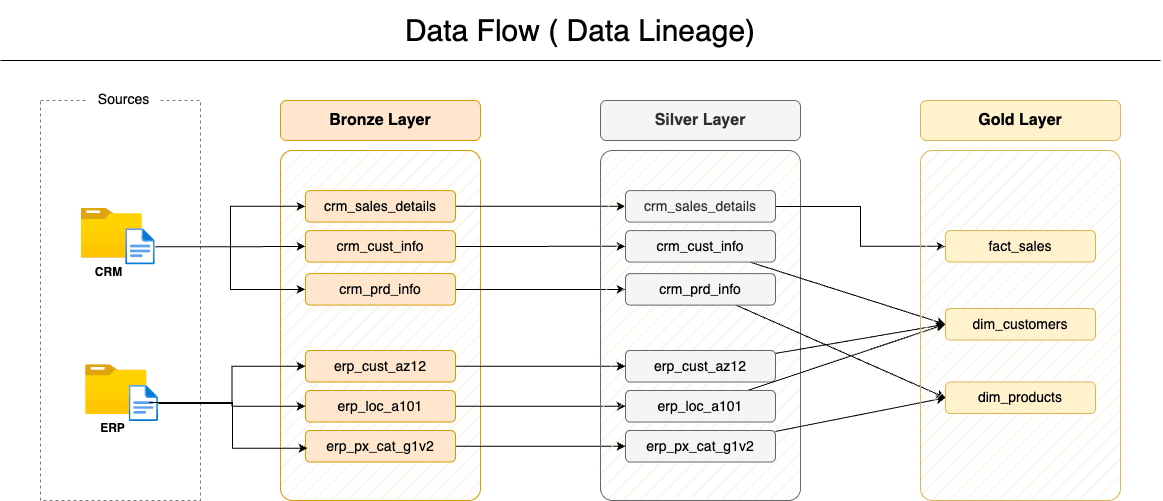
- ETL scripts were developed to clean and load CSV files using SQL.
- Ensured datatype consistency, resolved nulls, and created surrogate keys.
Indexing and Optimization
- Created indexes for faster joins (e.g., customer_key, product_key)
- Ensured normalization in dimension tables and denormalization in fact tables for performance
Final Queries
1CREATE VIEW gold.dim_customers AS
2SELECT
3    ROW_NUMBER() OVER (
4        ORDER BY cst_id
5    ) AS customer_key, -- Surrogate key
6    ci.cst_id AS customer_id,
7    ci.cst_key AS customer_number,
8    ci.cst_firstname AS first_name,
9    ci.cst_lastname AS last_name,
10    la.cntry AS country,
11    ci.cst_marital_status AS marital_status,
12    CASE
13        WHEN ci.cst_gndr != 'n/a' THEN ci.cst_gndr -- CRM is the primary source for gender
14        ELSE COALESCE(ca.gen, 'n/a') -- Fallback to ERP data
15    END AS gender,
16    ca.bdate AS birthdate,
17    ci.cst_create_date AS create_date
18FROM silver.crm_cust_info ci
19    LEFT JOIN silver.erp_cust_az12 ca ON ci.cst_key = ca.cid
20 LEFT JOIN silver.erp_loc_a101 la ON ci.cst_key = la.cid;1CREATE VIEW gold.dim_products AS
2SELECT
3 ROW_NUMBER() OVER (
4 ORDER BY pn.prd_start_dt, pn.prd_key
5 ) AS product_key, -- Surrogate key
6 pn.prd_id AS product_id,
7 pn.prd_key AS product_number,
8 pn.prd_nm AS product_name,
9 pn.cat_id AS category_id,
10 pc.cat AS category,
11 pc.subcat AS subcategory,
12 pc.maintenance AS maintenance,
13 pn.prd_cost AS cost,
14 pn.prd_line AS product_line,
15 pn.prd_start_dt AS start_date
16FROM silver.crm_prd_info pn
17 LEFT JOIN silver.erp_px_cat_g1v2 pc ON pn.cat_id = pc.id
18WHERE
19 pn.prd_end_dt IS NULL;1CREATE VIEW gold.fact_sales AS
2SELECT
3 sd.sls_ord_num AS order_number,
4 pr.product_key AS product_key,
5 cu.customer_key AS customer_key,
6 sd.sls_order_dt AS order_date,
7 sd.sls_ship_dt AS shipping_date,
8 sd.sls_due_dt AS due_date,
9 sd.sls_sales AS sales_amount,
10 sd.sls_quantity AS quantity,
11 sd.sls_price AS price
12FROM silver.crm_sales_details sd
13 LEFT JOIN gold.dim_products pr ON sd.sls_prd_key = pr.product_number
14 LEFT JOIN gold.dim_customers cu ON sd.sls_cust_id = cu.customer_id;📊 Phase 2: Advanced SQL Analytics
Once the warehouse was in place, the next step was leveraging SQL to answer key business questions.
✅ Business Questions Answered:
- What are the monthly and yearly trends in revenue and order count?
- Which products and customers are generating the most/least revenue?
- How does customer behavior vary by gender, location, or segment?
- What’s the average order value and product price over time?
✅ SQL Queries Used:
- Aggregation queries using GROUP BY, JOIN, and WINDOW functions
- Month-over-month and year-over-year comparisons using DATE_TRUNC and LAG
- Segmentation logic using CASE and RANK
1-- Find the top 10 customers who have generated the highest revenue
2SELECT c.customer_key, c.first_name, c.last_name, SUM(f.sales_amount) AS total_revenue
3FROM gold.fact_sales f
4    LEFT JOIN gold.dim_customers c ON c.customer_key = f.customer_key
5GROUP BY
6    c.customer_key,
7    c.first_name,
8    c.last_name
9ORDER BY total_revenue DESC
10LIMIT 10;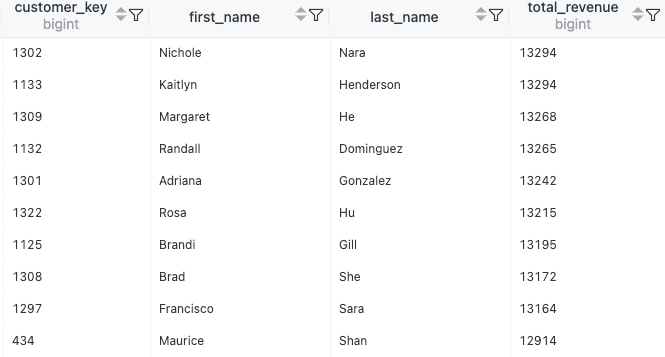
📈 Phase 3: Building Dashboards in Tableau
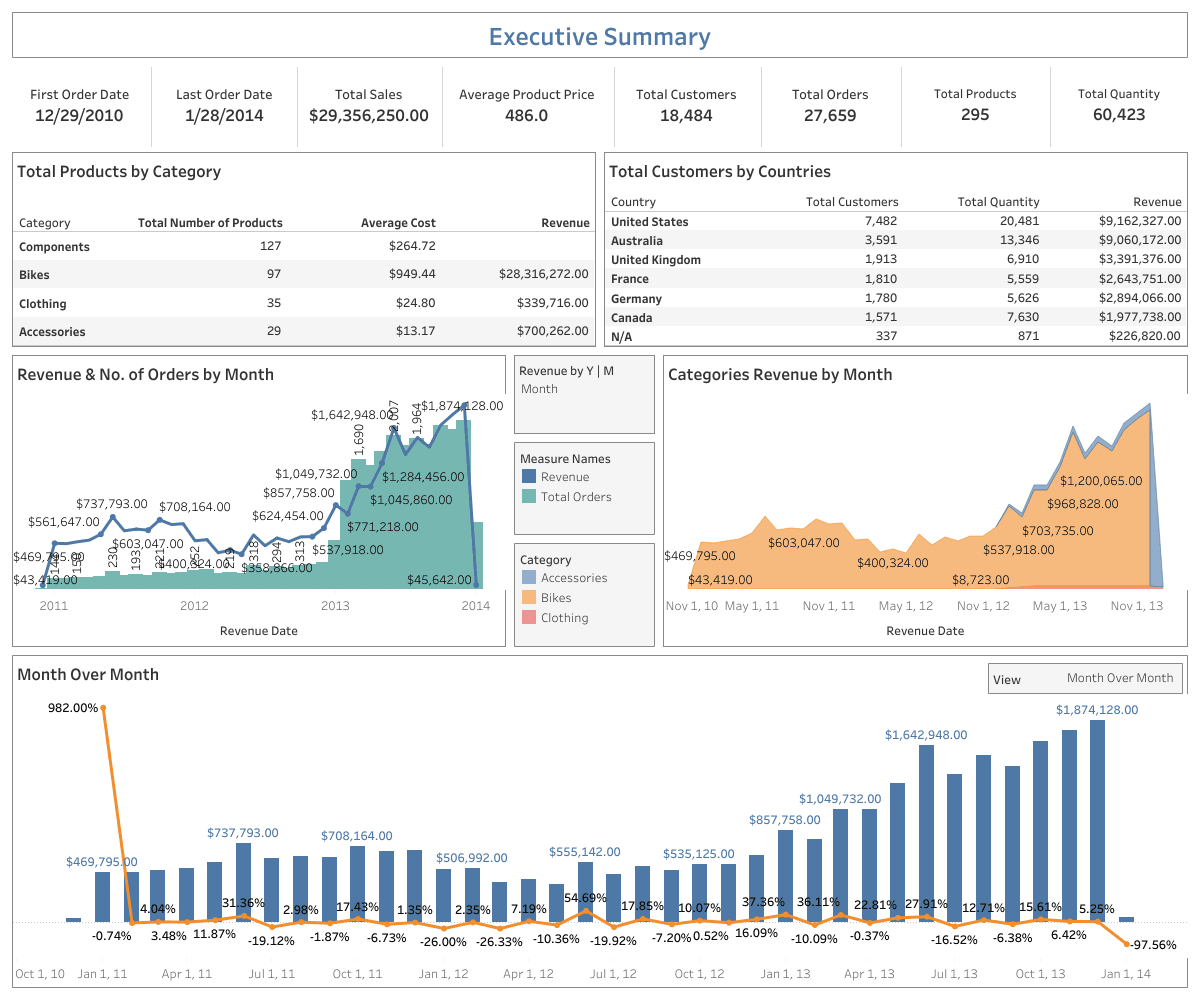
Executive Summary Dashboard
- 💵 Total Sales: $29M+
- 🧍 18K+ Customers
- 🚲 Category Sales: Bikes lead with $28M
- 🌎 Top Country: USA ($9.1M)
- 📆 Time Trends: Monthly revenue spikes & seasonality
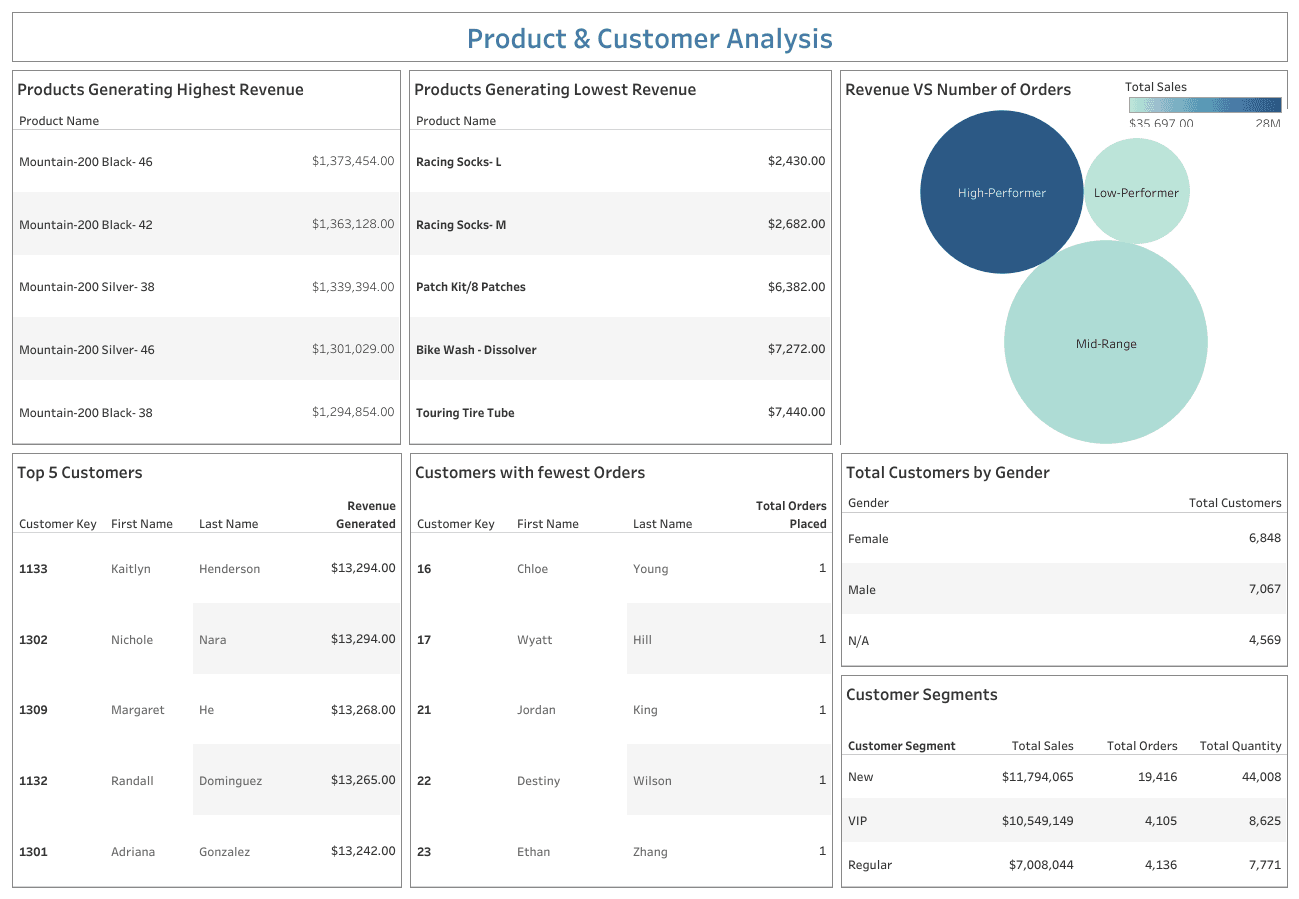
👥 Product & Customer Analysis Dashboard
- 🔝 Top Product: Mountain-200 Black-46 ($1.37M)
- 🧍♀️ Top Customer: Kaitlyn Henderson
- 🚻 Gender Split: Balanced engagement
- 🎯 Customer Segments: New customers dominate orders
📁 Final Deliverables
Documentation Included:
- Data Warehouse Schema
- SQL Scripts for KPIs
- ETL Code Samples
- Tableau Workbook (with filters & drill downs)
- Dashboard KPIs
🔮 What’s Next: Scaling with the Cloud
While this project was built on a local setup, the next big leap is cloud automation. Here's what that could look like:
- ☁️ AWS S3 to store raw sales, product, and customer files
- 🔄 AWS Glue to automate the ETL pipeline
- 🗃️ Amazon Redshift or RDS PostgreSQL to host the data warehouse
- 📅 Scheduled jobs to refresh data and dashboards regularly
- 📊 Tableau Server or Tableau Cloud to share dashboards with business users in real-time
This shift to a cloud-native stack would make the system more scalable, automated, and enterprise-ready — all without compromising on speed or flexibility.
🙌 Final Thoughts
No matter if you’re running a global enterprise or a niche bike shop like Mountain Riders, one thing’s clear — good data setup plus great visuals equals smarter decisions. With PostgreSQL doing the heavy lifting behind the scenes and Tableau bringing the numbers to life, you’ve got everything you need to uncover insights. Honestly, the real magic? It all starts with asking the right questions.